Utilisation de Vue.js pour créer un tableau de bord météo interactif avec des API
À propos de l'auteur
Souvik travaille comme rédacteur technique chez FusionCharts et possède une expérience des technologies et des bases de données back-end. Dans ses temps libres, Souvik s'amuse avec…
Pour en savoir plus sur Souvik …
La création d'un tableau de bord avec des données API est souvent une affaire complexe. Le choix de votre pile technologique, l'intégration d'API, la sélection des graphiques appropriés et l'amélioration des styles CSS peuvent devenir délicats. Ce didacticiel est un guide étape par étape expliquant comment vous aider à créer un tableau de bord météo dans Vue.js à l’aide des données de l’API.
(Cet article est sponsorisé.) Dans ce didacticiel, vous allez créer un tableau de bord météo simple à partir de rien. Ce sera une application client qui n'est ni un exemple «Hello World», ni une taille et une complexité trop intimidantes.
L'ensemble du projet sera développé à l'aide des outils de Node.js + npm écosystème. En particulier, nous nous appuierons fortement sur les API Dark Sky pour les données, sur la Vue.js pour tous les travaux lourds et sur la FusionCharts pour la visualisation des données.
Conditions préalables
Nous espérons que vous connaissez déjà les éléments suivants:
- HTML5 et CSS3 (nous utiliserons également les fonctionnalités de base fournies par Bootstrap ;
- JavaScript (en particulier la manière d'utiliser ES6 dans la langue);
- Node.js et npm (les bases de l'environnement et de la gestion des paquets sont tout à fait correctes).
En plus de celles mentionnées ci-dessus, ce serait super si vous connaissez Vue.js ou tout autre framework JavaScript similaire.Nous ne pensons pas que vous connaissiez FusionCharts – il est si facile à utiliser que vous l'apprendrez à la volée!
Enseignements attendus
Vos principaux enseignements de ce projet seront les suivants:
- Comment planifier ementing un bon tableau de bord
- Comment développer des applications avec Vue.js
- Comment créer des applications pilotées par les données
- Comment visualiser les données avec FusionCharts
En particulier, chacune des sections vous rapproche les objectifs d'apprentissage:
- Tableau de bord Introduction à la météo
Ce chapitre vous donne un aperçu des différents aspects de l'entreprise. - Créer le projet
Dans cette section, vous allez apprendre à créer projetez à partir de zéro à l'aide de l'outil de ligne de commande Vue - Personnalisation de la structure de projet par défaut
L'échafaudage de projet par défaut que vous obtenez dans la section précédente ne suffit pas; Ici, vous apprendrez les éléments supplémentaires nécessaires pour le projet d'un point de vue structurel. - Acquisition et traitement des données
Cette section est la base même du projet; tout le code critique pour l'acquisition et le traitement des données de l'API est présenté ici. Attendez-vous à consacrer un maximum de temps à cette section - Visualisation des données avec FusionCharts
Une fois que toutes les données et autres éléments mobiles du projet sont stabilisés, cette section est dédiée à la visualisation des données à l'aide de FusionCharts et d'un peu de CSS.
1. Le flux de travail du tableau de bord
Avant de plonger dans la mise en œuvre, il est important que notre plan soit clair. Nous divisons notre plan en quatre aspects distincts:
Exigences
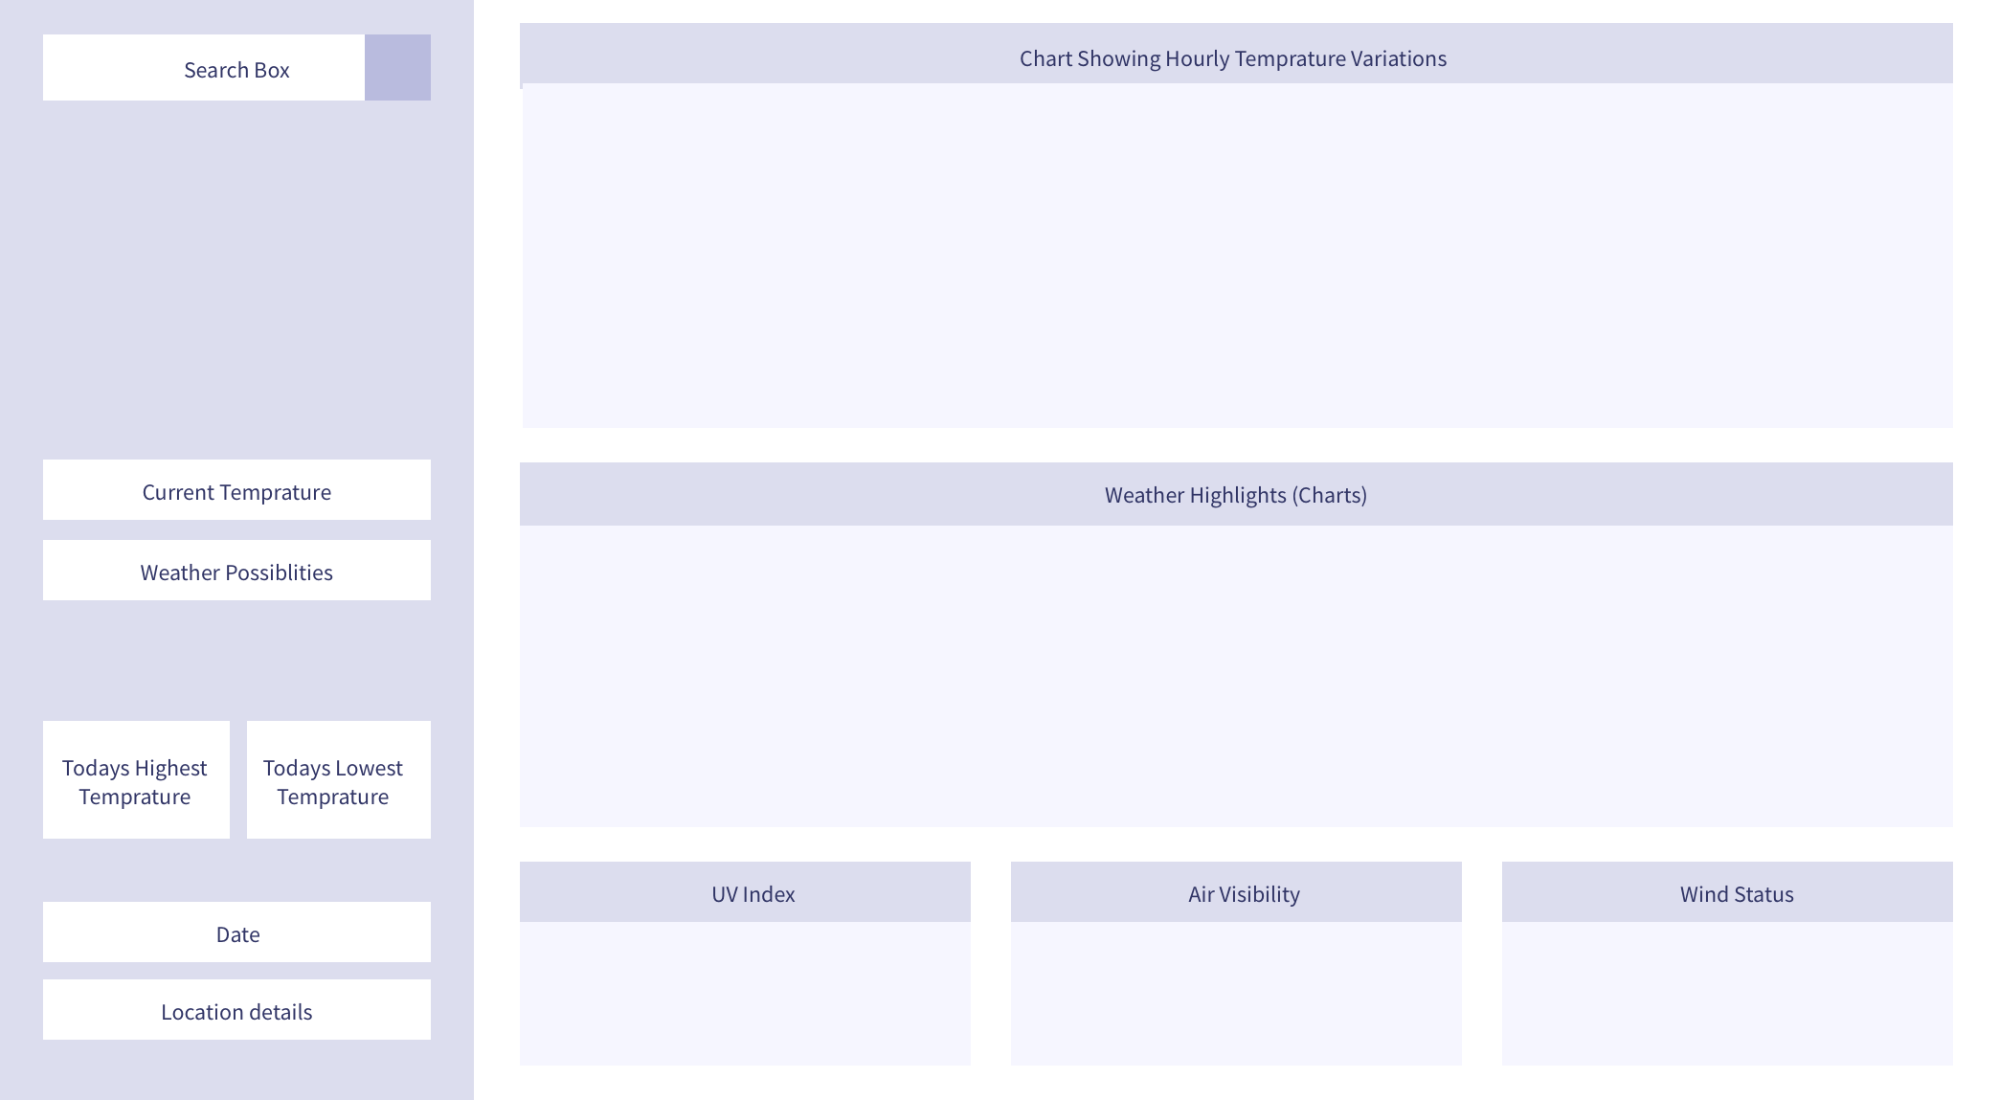
Quelles sont nos exigences pour ce projet? En d’autres termes, quelles sont les choses que nous souhaitons présenter dans notre tableau de bord météo? Gardant à l'esprit que notre public cible est probablement de simples mortels avec des goûts simples, nous aimerions leur montrer ce qui suit:
- Détails du lieu pour lequel ils veulent voir le temps, ainsi que quelques informations de base sur le temps. Comme il n’existe pas d’exigences strictes, nous verrons plus loin les détails ennuyeux. Cependant, à ce stade, il est important de noter que nous devrons fournir au public un champ de recherche afin qu'il puisse fournir des informations sur l'emplacement de son intérêt.
- Informations graphiques sur la météo de leur lieu d'intérêt, tel que:
- Variations de température pour le jour de la requête
- Points forts du temps actuel:
- Vitesse et direction du vent
- Visibilité
- Indice UV
Note : Les données obtenues à l'aide de l'API fournissent des informations sur de nombreux autres aspects de la météo. Nous avons choisi de ne pas les utiliser toutes afin de minimiser le code.
Structure
Sur la base des exigences, nous pouvons structurer notre tableau de bord comme indiqué ci-dessous:

Données
Notre tableau de bord est aussi bon que les données que nous avons, car il n’y aura pas de jolies visualisations sans données appropriées. De nombreuses API publiques fournissent des données météorologiques. Certaines sont gratuites, d'autres non. Pour notre projet, nous allons collecter des données à partir de l'API Dark Sky . Cependant, nous ne pourrons pas interroger directement le point de terminaison de l'API à partir de l'extrémité client. Ne vous inquiétez pas, nous avons une solution de contournement qui sera révélée juste au bon moment! Une fois que nous aurons obtenu les données pour le lieu recherché, nous effectuerons quelques traitements et formatages de données – vous savez, le type de détails techniques qui nous aident à payer les factures. dans FusionCharts. Il existe très peu de bibliothèques JavaScript dans le monde aussi capables que FusionCharts. Parmi les nombreuses offres de FusionCharts, nous n'en utiliserons que quelques-unes – toutes écrites en JavaScript, mais fonctionnant de manière transparente lorsqu'elles sont intégrées à l'encapsuleur Vue pour FusionCharts .
Armés de la vue d'ensemble, se salir les mains – il est temps de concrétiser les choses! Dans la section suivante, vous créerez le projet de base Vue, sur lequel nous bâtirons davantage.
2. Création du projet
Pour créer le projet, procédez comme suit:
- Installez Node.js + npm
( Si Node.js est installé sur votre ordinateur, ignorez cette étape. )
Node.js est fourni avec npm, vous n'avez donc pas besoin d'installer npm séparément. En fonction du système d'exploitation, téléchargez et installez Node.js conformément aux instructions données ici .Une fois installé, vérifiez que le logiciel fonctionne correctement et quelles en sont les versions. . Pour tester cela, ouvrez la ligne de commande / terminal et exécutez les commandes suivantes:
node --version npm --version
- Installation des packages avec npm
Une fois que vous avez activé npm, exécutez la commande suivante pour installer les packages de base nécessaires à notre projet:npm install -g vue @ 2 vue-cli @ 2
- Initialisez le projet d'échafaudage avec
vue-cli
En supposant que l'étape précédente s'est bien déroulée, l'étape suivante consiste à utiliser levue-cli
– une ligne de commande outil de Vue.js, pour initialiser le projet. Pour ce faire, exécutez ce qui suit:
- Initialisez l'échafaudage avec le modèle webpack-simple.
vue init webpack-simple vue_weather_dashboard
On vous posera un tas de questions – accepter les valeurs par défaut pour tous sauf la dernière question suffira pour ce projet; répondez
N
pour le dernier.
( Grand aperçu ) N'oubliez pas que même si
webpack-simple
est excellent pour le prototypage rapide et les applications légères comme le nôtre, il n'est pas particulièrement adapté aux applications sérieuses ou au déploiement de la production. Si vous souhaitez utiliser un autre modèle (bien que nous le déconseillions si vous êtes un débutant), ou si vous souhaitez nommer votre projet autrement, la syntaxe est la suivante:
vue init [template-name] [project-name]
- Accédez au répertoire créé par vue-cli pour le projet.
cd vue_weather_dashboard
- Installez tous les packages mentionnés dans le package
package.json
créé à l'aide de l'outilvue-cli
pour le modèlewebpack-simple
.
npm install
- Lancez le serveur de développement et voyez votre projet Vue par défaut fonctionner dans le navigateur!
npm run dev
Si vous êtes nouveau dans Vue.js prenez un moment pour savourer votre dernier exploit. Vous avez créé une petite application Vue et son exécution sous localhost: 8080 ! ] Une capture d’écran du site Vue.js « />
Brève explication de la structure de projet par défaut
Il est temps de jeter un coup d'œil à la structure du répertoire vue_weather_dashboard
afin de bien comprendre les bases avant de commencer à le modifier. ] La structure ressemble à ceci:
vue_weather_dashboard
| --- LISEZMOI.md
| --- node_modules /
| | --- ...
| | --- ...
| | --- [many npm packages we installed]
| | --- ...
| | --- ...
| --- package.json
| --- package-lock.json
| --- webpack.config.js
| --- index.html
| --- src
| | --- App.vue
| | --- atouts
| | | --- logo.png
| | --- main.js
Bien qu'il soit tentant de ne pas vous familiariser avec les fichiers et les répertoires par défaut, si vous êtes nouveau dans Vue, nous vous recommandons vivement de regarder au moins le contenu de ces fichiers. Cela peut être une bonne séance d’enseignement et susciter des questions que vous devriez approfondir vous-même, en particulier les fichiers suivants:
-
package.json
et un simple coup d’œil sur son cousin. json
-
webpack.config.js
-
index.html
-
src / main.js
src / App.vue
Une brève explication de chacun des fichiers et répertoires montrés dans l’arborescence est donnée ci-dessous:
- README.md
Aucun prix à deviner – c’est principalement pour les humains lisez et comprenez les étapes nécessaires à la création de l'échafaudage du projet . - node_modules /
Il s'agit du répertoire dans lequel npm télécharge les packages nécessaires au démarrage du projet. Les informations sur les packages nécessaires sont disponibles dans le fichierpackage.json
. - package.json
Ce fichier est créé à l'aide de l'outil vue-cli basé sur les exigences du pack Web-simple
contient des informations sur les packages npm (y compris leurs versions et d'autres détails) qui doivent être installés. Examinez de près le contenu de ce fichier – c’est là que vous devriez vous rendre et éventuellement éditer pour ajouter / supprimer les paquetages nécessaires au projet, puis lancer npm install. En savoir plus surpackage.json
ici . - package-lock.json
Ce fichier est créé par npm et est principalement destiné à la gestion d'un journal contenant des éléments téléchargés et téléchargés par npm. installé. - webpack.config.js
Il s’agit d’un fichier JavaScript contenant la configuration de webpack – un outil regroupant différents aspects de notre projet (code, ressources statiques, configuration, environnements, mode d’utilisation, etc.). ), et réduit avant de le servir à l'utilisateur. L’avantage est que tous les éléments sont liés automatiquement et que l’expérience utilisateur s’améliore considérablement en raison de l’amélioration des performances de l’application (les pages sont rapidement servies et chargées sur le navigateur). Comme vous le constaterez peut-être plus tard, il s’agit du fichier à inspecter lorsque quelque chose dans le système de construction ne fonctionne pas comme prévu. De plus, lorsque vous souhaitez déployer l'application, il s'agit de l'un des fichiers clés à modifier (plus d'informations ici ). - index.html
Ce fichier HTML sert de matrice. (ou vous pouvez dire, modèle) où les données et le code doivent être incorporés de façon dynamique (c'est ce que fait Vue principalement), puis transmis à l'utilisateur. - src / main.js
Ce fichier JavaScript contient un code principalement gère les dépendances de niveau supérieur / projet et définit le composant Vue le plus élevé. En bref, il orchestre le code JavaScript pour l’ensemble du projet et sert de point d’entrée à l’application. Modifiez ce fichier lorsque vous devez déclarer des dépendances à l'échelle du projet sur certains modules de noeud ou si vous souhaitez modifier quelque chose à propos du composant Vue le plus élevé du projet. - src / App.vue
nous parlions du «composant Vue le plus élevé», nous parlions essentiellement de ce fichier. Chaque fichier .vue du projet est un composant et les composants sont liés hiérarchiquement. Au début, nous n’avions qu’un seul fichier.vue
c’est-à-direApp.vue
en tant que composant unique. Mais nous allons bientôt ajouter d'autres composants à notre projet (en suivant principalement la structure du tableau de bord) et les lier conformément à notre hiérarchie souhaitée, avec App.vue étant l'ancêtre de tous. Ces fichiers.vue
contiendront du code dans un format que Vue voudrait que nous écrivions. Ne vous inquiétez pas, ce sont du code JavaScript écrit qui maintient une structure qui peut nous garder sain d’esprit et organisé. Vous avez été prévenu – à la fin de ce projet, si vous êtes nouveau dans Vue, vous risquez de devenir accro au modèle& mdash; script & mdash; style
façon d'organiser le code!
Maintenant que nous avons créé la base, il est temps de:
- Modifiez les modèles et modifiez un peu les fichiers de configuration afin que le projet se comporte exactement comme nous le souhaitons. 19659015] Créez de nouveaux fichiers
.vue
et implémentez la structure du tableau de bord avec le code Vue.
Nous les apprendrons dans la section suivante, qui va être un peu longue et qui nécessite un peu d'attention. Si vous avez besoin de caféine ou d’eau, ou si vous voulez vous libérer, le moment est venu!
3. Personnalisation de la structure de projet par défaut
Il est temps de modifier les fondements fournis par le projet échafaudé. Avant de commencer, assurez-vous que le serveur de développement fourni par webpack
est en cours d'exécution. L’avantage d’exécuter ce serveur en continu est que toutes les modifications que vous apportez au code source (que vous enregistrez et actualisez la page Web) soient immédiatement répercutées sur le navigateur.
Si vous souhaitez démarrer le serveur de développement, exécutez simplement la commande suivante depuis le terminal (en supposant que votre répertoire actuel est le répertoire du projet):
npm run dev
Dans les sections suivantes, nous allons modifier certains des fichiers existants et en ajouter de nouveaux.
Elle sera suivie de brèves explications sur le contenu de ces fichiers, de manière à vous donner une idée de ce que ces modifications sont censées faire.
Modifier les fichiers existants
index.html
Notre application est littéralement une simple l'application de page, car il n'y a qu'une seule page Web qui est affichée sur le navigateur. Nous en reparlerons plus tard, mais commençons par notre premier changement: modifier le texte dans la balise
Avec cette petite révision, le fichier HTML ressemble à ce qui suit:
Vue Weather Dashboard
Prenez un moment pour actualiser la page Web à l'adresse localhost: 8080
et voir le changement reflété dans la barre de titre de l'onglet du navigateur – il devrait indiquer «Vue Weather Dashboard». Cependant, il s’agissait simplement de vous montrer comment procéder pour apporter des modifications et vérifier s’il fonctionne. Nous avons plus de choses à faire!
Cette page HTML simple manque beaucoup de choses que nous souhaitons dans notre projet, notamment les suivantes:
- Quelques méta-informations
- Les liens au format CDN vers Bootstrap (framework CSS)
- vers feuille de style personnalisée (à ajouter dans le projet)
- Pointeurs sur l'API de géolocalisation de Google Maps à partir de la balise
Weather Dashboard
Enregistrez le fichier et actualisez la page Web. Vous avez peut-être remarqué une légère secousse pendant le chargement de la page - cela est principalement dû au fait que le style de page est maintenant contrôlé par Bootstrap et que les éléments de style tels que les polices, l'espacement, etc. sont différents de ceux par défaut. plus tôt (si vous n’êtes pas sûr, revenez à la valeur par défaut et voyez la différence.)

Note : Avant de poursuivre, l'URL de l'API Google Maps contient une clé qui est une propriété de FusionCharts. Pour le moment, vous pouvez utiliser cette clé pour construire le projet, car nous ne voulons pas que vous vous perdiez dans ce type de détails infimes (qui peuvent être une source de distraction lorsque vous êtes nouveau). Cependant, nous vous incitons vivement à générer et utiliser votre propre clé d’API Google Maps une fois que vous avez progressé et que vous êtes à l’aise pour prêter attention à ces petits détails.
package.json
Au moment de la rédaction, nous avons utilisé certaines versions des packages npm pour notre projet, et nous savons avec certitude que ces éléments fonctionnent ensemble. Cependant, au moment où vous exécutez le projet, il est fort possible que les dernières versions stables des packages que npm télécharge pour vous ne soient pas les mêmes que ceux que nous utilisions, ce qui pourrait casser le code (ou faire des choses au-delà). notre contrôle). Il est donc très important d’avoir exactement le même fichier package.json
qui a été utilisé pour générer ce projet, afin que notre code / explications et les résultats obtenus soient cohérents.
Le fichier package.json
devrait être:
{
"name": "vue_weather_dashboard",
"description": "Un projet Vue.js",
"version": "1.0.0",
"author": "FusionCharts",
"licence": "MIT",
"privé": vrai,
"scripts": {
"dev": "cross-env NODE_ENV = développement webpack-dev-server --open --hot",
"build": "cross-env NODE_ENV = pack de production --progress --hide-modules"
},
"dépendances": {
"axios": "^ 0.18.0",
"babel": "^ 6.23.0",
"babel-cli": "^ 6.26.0",
"babel-polyfill": "^ 6.26.0",
"fusioncharts": "^ 3.13.3",
"moment": "^ 2.22.2",
"moment-fuseau horaire": "^ 0.5.21",
"vue": "^ 2.5.11",
"vue-fusioncharts": "^ 2.0.4"
},
"liste de navigateurs": [
"> 1%",
"2 dernières versions",
"not ie
Nous vous encourageons à parcourir le nouveau package.json
et à déterminer quelles sont les fonctions de différents objets du json. Vous préférerez peut-être modifier la valeur de l'auteur"
"clé de votre nom. De plus, les paquets mentionnés dans les dépendances se révéleront au bon moment dans le code. Pour le moment, il suffit de savoir que:
-
babel
- les paquets associés permettent de gérer correctement le code de style ES6 par le navigateur; -
axios
traite les demandes basées sur la promesse ; -
moment
et moment -timezone sert à la manipulation de la date / heure; -
fusioncharts
etvue-fusioncharts
sont responsables du rendu des graphiques: -
vue
pour des raisons évidentes.
webpack.config.js
Comme pour package.json
nous vous suggérons de maintenir un webpa ck.config.js
qui correspond à celui que nous avons utilisé pour construire le projet. Cependant, avant d’apporter des modifications, nous vous recommandons de comparer soigneusement le code par défaut du fichier webpack.config.js
et le code fourni ci-dessous. Vous remarquerez quelques différences - google les et avoir une idée de base de ce qu'ils signifient. Comme l'explication détaillée des configurations de WebPack dépasse le cadre de cet article, vous êtes autonome à cet égard.
Le fichier personnalisé webpack.config.js
est le suivant:
var chemin = require ('path')
var webpack = require ('webpack')
module.exports = {
entrée: ['babel-polyfill', './src/main.js'],
sortie: {
path: path.resolve (__ dirname, './dist'),
publicPath: '/ dist /',
nom du fichier: 'build.js'
},
module: {
règles: [
{
test: /.css$/,
use: [
'vue-style-loader',
'css-loader'
],
}, {
test: /.vue$/,
loader: 'vue-loader',
options: {
chargeurs: {
}
// autres options de vue-loader allez ici
}
},
{
test: /.js$/,
chargeur: 'babel-loader',
exclure: / node_modules /
},
{
test: /.(png|jpg|gif|svg)$/,
loader: 'chargeur de fichiers',
options: {
nom: "[name]. [ext]? [hash]"
}
}
]
},
résoudre: {
alias: {
'vue $': 'vue / dist / vue.esm.js'
},
extensions: ['*', '.js', '.vue', '.json']
},
devServer: {
historyApiFallback: true,
noInfo: true,
superposition: vrai,
hôte: '0.0.0.0',
port: 8080
},
performance: {
allusions: faux
},
devtool: '# eval-source-map'
}
if (process.env.NODE_ENV === 'production') {
module.exports.devtool = '# source-map'
// http://vue-loader.vuejs.org/fr/workflow/production.html
module.exports.plugins = (module.exports.plugins || []). concat ([
new webpack.DefinePlugin({
'process.env': {
NODE_ENV: '"production"'
}
}),
new webpack.optimize.UglifyJsPlugin({
sourceMap: true,
compress: {
warnings: false
}
}),
new webpack.LoaderOptionsPlugin({
minimize: true
})
])
}
Avec les modifications apportées au projet webpack.config.js
il est impératif d'arrêter le serveur de développement en cours d'exécution ( Ctrl + C ). et redémarrez-le avec la commande suivante exécutée à partir du répertoire du projet après avoir installé tous les packages mentionnés dans le fichier package.json
:
npm install
npm run dev
Avec cela, se termine l'épreuve consistant à peaufiner les configurations et à s'assurer que les bons packages sont en place. Cependant, cela marque également le chemin de la modification et de l'écriture de code, ce qui est un peu long mais aussi très enrichissant!
src / main.js
Ce fichier est la clé de l'orchestration de haut niveau du projet - il est voici ce que nous définissons:
- Quelles sont les dépendances de niveau supérieur (où obtenir les packages npm les plus importants nécessaires);
- Comment résoudre les dépendances, ainsi que les instructions à Vue pour l'utilisation de plugins / wrappers, le cas échéant; [19659015] Instance Vue qui gère le composant le plus important du projet:
src / App.vue
(fichier nodal.vue
).
Conformément à nos objectifs pour le src / main.js
le code devrait être:
// Importez les dépendances et les modules nécessaires.
importer Vue de 'vue';
importer l'application depuis './App.vue';
importer des FusionCharts à partir de 'fusioncharts';
importer des graphiques à partir de "fusioncharts / fusioncharts.charts";
importer des widgets à partir de 'fusioncharts / fusioncharts.widgets';
importer des PowerCharts à partir de 'fusioncharts / fusioncharts.powercharts';
importer FusionTheme à partir de 'fusioncharts / themes / fusioncharts.theme.fusion';
importer VueFusionCharts à partir de 'vue-fusioncharts';
// Résoudre les dépendances
Les graphiques (FusionCharts);
PowerCharts (FusionCharts);
Widgets (FusionCharts);
FusionTheme (FusionCharts);
// Enregistrer globalement les composants pour une utilisation dans l'ensemble du projet
Vue.use (VueFusionCharts, FusionCharts);
// Instancie l'instance Vue qui contrôle l'application
nouveau Vue ({
el: '#app',
rendre: h => h (App)
})
src / App.vue
Il s'agit de l'un des fichiers les plus importants de l'ensemble du projet. Il représente le composant le plus haut de la hiérarchie - l'ensemble de l'application elle-même. Pour notre projet, cette composante fera le gros du travail, que nous explorerons plus tard. Pour l'instant, nous voulons supprimer le passe-partout par défaut et mettre quelque chose de propre.
Si vous connaissez encore mieux la façon dont Code a organisé le code, il serait préférable de se faire une idée de la structure générale au sein du . ] .vue
fichiers. Les fichiers .vue
se composent de trois sections:
- Modèle
C'est ici que le modèle HTML de la page est défini. Outre le code HTML statique, cette section contient également la méthode d’incorporation de contenu dynamique de Vue à l’aide des doubles accolades{{}}
. - Script
Le code JavaScript qui régit cette section est la responsabilité de la génération contenu dynamique qui va et se repose dans le modèle HTML aux endroits appropriés. Cette section est principalement un objet qui est exporté et comprend:- Données
Il s'agit d'une fonction elle-même, qui renvoie généralement certaines données souhaitées encapsulées dans une structure de données intéressante. - Méthodes
Un objet qui consiste en une ou plusieurs fonctions / méthodes, chacune qui manipule généralement les données d’une manière ou d’une autre, et contrôle également le contenu dynamique du modèle HTML. - Calculée
Tout comme l’objet méthode décrit ci-dessus avec une distinction importante: toutes les fonctions de l’objet méthode sont identiques. sont exécutées à chaque appel de l'une d'entre elles, les fonctions de l'objet calculé se comportent beaucoup plus judicieusement et s'exécutent si et seulement si cet appel a été appelé.
- Données
- Style
Cette section concerne le style CSS qui s'applique au code HTML de la page (écrit dans un modèle) - placez le bon vieux CSS ici pour rendre vos pages superbes!
Conserver le paradigme ci-dessus l'esprit, personnalisons le code au minimum dans App.vue
:
Le code de ce composant est dans {{nom de fichier}}
N'oubliez pas que l'extrait de code ci-dessus sert simplement à vérifier que App.vue
utilise notre propre code. Il faudra ensuite beaucoup de modifications, mais enregistrez d'abord le fichier et actualisez la page sur le navigateur.

À ce stade, c’est probablement une bonne idée de demander de l’aide en outillage. Consultez la Vue devtools pour Chrome et si vous n’avez pas beaucoup de problèmes à utiliser Google Chrome comme navigateur par défaut pour le développement, installez l’outil et jouez un peu avec lui. Cela s'avérera extrêmement pratique pour le développement ultérieur et le débogage, lorsque la situation deviendra plus compliquée.
Répertoires et fichiers supplémentaires
La prochaine étape consistera à ajouter des fichiers supplémentaires afin que la structure de notre projet soit complète. Nous ajouterions les répertoires et les fichiers suivants:
Note : Enregistrez les fichiers .svg
avec hyperliens dans votre projet.
Créez les répertoires et les fichiers. mentionné ci-dessus. La structure finale du projet doit ressembler (rappelez-vous de supprimer les dossiers et les fichiers de la structure par défaut désormais inutiles):
vue_weather_dashboard /
| --- LISEZMOI.md
| --- node_modules /
| | --- ...
| | --- ...
| | --- [many npm packages we installed]
| | --- ...
| | --- ...
| --- package.json
| --- package-lock.json
| --- webpack.config.js
| --- index.html
| --- src /
| | --- App.vue
| | --- css /
| | | --- style.css
| | --- actifs /
| | | --- calendar.svg
| | | --- location.svg
| | | --- location.svg
| | | --- winddirection.svg
| | | --- windspeed.svg
| | --- main.js
| | --- composants /
| | | --- Content.vue
| | | --- Highlights.vue
| | | --- TempVarChart.vue
| | | --- UVIndex.vue
| | | --- Visibility.vue
| | | --- WindStatus.vue
Il peut y avoir d'autres fichiers, tels que .babelrc
.gitignore
.editorconfig
etc. dans le dossier racine du projet. Vous pouvez les ignorer en toute sécurité pour le moment.
Dans la section suivante, nous allons ajouter un contenu minimal aux nouveaux fichiers ajoutés et tester leur fonctionnement.
src / css / style.css [19659115] Bien que cela ne soit pas très utile immédiatement, copiez le code suivant dans le fichier: @import url ("https://fonts.googleapis.com/css?family=Roboto:300,400,500");
:racine {
taille de police: 62,5%;
}
corps {
famille de polices: Roboto;
poids de la police: 400;
largeur: 100%;
marge: 0;
taille de la police: 1.6rem;
}
#sidebar {
position: relative;
affichage: flex;
direction de flexion: colonne;
image d'arrière-plan: gradient linéaire (-180deg, # 80b6db 0%, # 7da7e2 100%);
}
#chercher {
text-align: center;
hauteur: 20vh;
position: relative;
}
# location-input {
hauteur: 42px;
largeur: 100%;
opacité: 1;
bordure: 0;
border-radius: 2px;
couleur de fond: rgba (255, 255, 255, 0.2);
marge supérieure: 16px;
padding-left: 16px;
couleur: #ffffff;
taille de la police: 1.8rem;
hauteur de ligne: 21px;
}
# location-input: focus {
contour: aucun;
}
:: espace réservé {
couleur: #FFFFFF;
opacité: 0,6;
}
#météo actuelle {
couleur: #ffffff;
taille de police: 8rem;
hauteur de ligne: 106px;
position: relative;
}
# météo actuelle> span {
couleur: #ffffff;
taille de la police: 3.6rem;
hauteur de ligne: 42px;
alignement vertical: super;
opacité: 0,8;
en haut: 15px;
position: absolue;
}
# weather-desc {
taille de la police: 2.0rem;
couleur: #ffffff;
poids de la police: 500;
hauteur de ligne: 24px;
}
#possibility {
couleur: #ffffff;
taille de police: 16px;
poids de la police: 500;
hauteur de ligne: 19px;
}
# max-detail,
# min-detail {
couleur: #ffffff;
taille de la police: 2.0rem;
poids de la police: 500;
hauteur de ligne: 24px;
}
# max-detail> i,
# min-detail> i {
style de police: normal;
hauteur: 13.27px;
largeur: 16.5px;
opacité: 0,4;
}
# max-detail> span,
# min-detail> span {
couleur: #ffffff;
famille de polices: Roboto;
taille de la police: 1.2rem;
hauteur de ligne: 10px;
alignement vertical: super;
}
# max-summary,
# min-summary {
opacité: 0,9;
couleur: #ffffff;
taille de la police: 1.4rem;
hauteur de ligne: 16px;
marge supérieure: 2px;
opacité: 0,7;
}
# search-btn {
position: absolue;
à droite: 0;
en haut: 16px;
rembourrage: 2px;
z-index: 999;
hauteur: 42px;
largeur: 45px;
couleur de fond: rgba (255, 255, 255, 0.2);
bordure: aucune;
}
# contenu du tableau de bord {
text-align: center;
hauteur: 100vh;
}
# date-desc,
# location-desc {
couleur: #ffffff;
taille de la police: 1.6rem;
poids de la police: 500;
hauteur de ligne: 19px;
marge inférieure: 15 px;
}
# date-desc> img {
en haut: -3px;
position: relative;
marge droite: 10px;
}
# location-desc> img {
en haut: -3px;
position: relative;
marge gauche: 5px;
marge droite: 15px;
}
# location-detail {
opacité: 0,7;
couleur: #ffffff;
taille de la police: 1.4rem;
hauteur de ligne: 20px;
marge gauche: 35px;
}
.centered {
position: fixe;
en haut: 45%;
à gauche: 50%;
transformer: traduire (-50%, -50%);
}
.max-desc {
largeur: 80px;
float: gauche;
marge droite: 28px;
}
.temp-max-min {
marge supérieure: 40px
}
# contenu du tableau de bord {
couleur de fond: # F7F7F7;
}
.custom-card {
background-color: #FFFFFF! important;
bordure: 0! important;
margin-top: 16px! important;
margin-bottom: 20px! important;
}
.custom-content-card {
background-color: #FFFFFF! important;
bordure: 0! important;
margin-top: 16px! important;
margin-bottom: 0px! important;
}
.header-card {
hauteur: 50vh;
}
.content-card {
hauteur: 43vh;
}
.card-divider {
marge supérieure: 0;
}
.content-header {
couleur: # 8786A4;
taille de la police: 1.4rem;
hauteur de ligne: 16px;
poids de la police: 500;
remplissage: 15px 10px 5px 15px;
}
.highlights-item {
hauteur minimale: 37vh;
hauteur maximale: 38vh;
couleur de fond: #FFFFFF;
}
.card-heading {
couleur: RGB (33, 34, 68);
taille de la police: 1.8rem;
poids de la police: 500;
hauteur de ligne: 21px;
text-align: center;
}
.card-sous-rubrique {
couleur: # 73748C;
taille de la police: 1.6rem;
hauteur de ligne: 19px;
}
.card-value {
couleur: # 000000;
taille de la police: 1.8rem;
hauteur de ligne: 21px;
}
span text {
poids de la police: 500! important;
}
hr {
rembourrage en haut: 1.5px;
rembourrage en bas: 1px;
marge inférieure: 0;
marge supérieure: 0;
hauteur de ligne: 0.5px;
}
Écran @média uniquement et (largeur minimale: 768 pixels) {
#sidebar {
hauteur: 100vh;
}
#Info {
position: fixed;
bottom: 50px;
largeur: 100%;
padding-left: 15px;
}
.wrapper-right {
margin-top: 80px;
}
}
@media only screen and (min-width:1440px) {
#sidebar {
width: 350px;
max-width: 350px;
flex: auto;
}
#dashboard-content {
width: calc(100% — 350px);
max-width: calc(100% — 350px);
flex: auto;
}
}
src/assets/
@import url ("https://fonts.googleapis.com/css?family=Roboto:300,400,500");
:racine {
taille de police: 62,5%;
}
corps {
famille de polices: Roboto;
poids de la police: 400;
largeur: 100%;
marge: 0;
taille de la police: 1.6rem;
}
#sidebar {
position: relative;
affichage: flex;
direction de flexion: colonne;
image d'arrière-plan: gradient linéaire (-180deg, # 80b6db 0%, # 7da7e2 100%);
}
#chercher {
text-align: center;
hauteur: 20vh;
position: relative;
}
# location-input {
hauteur: 42px;
largeur: 100%;
opacité: 1;
bordure: 0;
border-radius: 2px;
couleur de fond: rgba (255, 255, 255, 0.2);
marge supérieure: 16px;
padding-left: 16px;
couleur: #ffffff;
taille de la police: 1.8rem;
hauteur de ligne: 21px;
}
# location-input: focus {
contour: aucun;
}
:: espace réservé {
couleur: #FFFFFF;
opacité: 0,6;
}
#météo actuelle {
couleur: #ffffff;
taille de police: 8rem;
hauteur de ligne: 106px;
position: relative;
}
# météo actuelle> span {
couleur: #ffffff;
taille de la police: 3.6rem;
hauteur de ligne: 42px;
alignement vertical: super;
opacité: 0,8;
en haut: 15px;
position: absolue;
}
# weather-desc {
taille de la police: 2.0rem;
couleur: #ffffff;
poids de la police: 500;
hauteur de ligne: 24px;
}
#possibility {
couleur: #ffffff;
taille de police: 16px;
poids de la police: 500;
hauteur de ligne: 19px;
}
# max-detail,
# min-detail {
couleur: #ffffff;
taille de la police: 2.0rem;
poids de la police: 500;
hauteur de ligne: 24px;
}
# max-detail> i,
# min-detail> i {
style de police: normal;
hauteur: 13.27px;
largeur: 16.5px;
opacité: 0,4;
}
# max-detail> span,
# min-detail> span {
couleur: #ffffff;
famille de polices: Roboto;
taille de la police: 1.2rem;
hauteur de ligne: 10px;
alignement vertical: super;
}
# max-summary,
# min-summary {
opacité: 0,9;
couleur: #ffffff;
taille de la police: 1.4rem;
hauteur de ligne: 16px;
marge supérieure: 2px;
opacité: 0,7;
}
# search-btn {
position: absolue;
à droite: 0;
en haut: 16px;
rembourrage: 2px;
z-index: 999;
hauteur: 42px;
largeur: 45px;
couleur de fond: rgba (255, 255, 255, 0.2);
bordure: aucune;
}
# contenu du tableau de bord {
text-align: center;
hauteur: 100vh;
}
# date-desc,
# location-desc {
couleur: #ffffff;
taille de la police: 1.6rem;
poids de la police: 500;
hauteur de ligne: 19px;
marge inférieure: 15 px;
}
# date-desc> img {
en haut: -3px;
position: relative;
marge droite: 10px;
}
# location-desc> img {
en haut: -3px;
position: relative;
marge gauche: 5px;
marge droite: 15px;
}
# location-detail {
opacité: 0,7;
couleur: #ffffff;
taille de la police: 1.4rem;
hauteur de ligne: 20px;
marge gauche: 35px;
}
.centered {
position: fixe;
en haut: 45%;
à gauche: 50%;
transformer: traduire (-50%, -50%);
}
.max-desc {
largeur: 80px;
float: gauche;
marge droite: 28px;
}
.temp-max-min {
marge supérieure: 40px
}
# contenu du tableau de bord {
couleur de fond: # F7F7F7;
}
.custom-card {
background-color: #FFFFFF! important;
bordure: 0! important;
margin-top: 16px! important;
margin-bottom: 20px! important;
}
.custom-content-card {
background-color: #FFFFFF! important;
bordure: 0! important;
margin-top: 16px! important;
margin-bottom: 0px! important;
}
.header-card {
hauteur: 50vh;
}
.content-card {
hauteur: 43vh;
}
.card-divider {
marge supérieure: 0;
}
.content-header {
couleur: # 8786A4;
taille de la police: 1.4rem;
hauteur de ligne: 16px;
poids de la police: 500;
remplissage: 15px 10px 5px 15px;
}
.highlights-item {
hauteur minimale: 37vh;
hauteur maximale: 38vh;
couleur de fond: #FFFFFF;
}
.card-heading {
couleur: RGB (33, 34, 68);
taille de la police: 1.8rem;
poids de la police: 500;
hauteur de ligne: 21px;
text-align: center;
}
.card-sous-rubrique {
couleur: # 73748C;
taille de la police: 1.6rem;
hauteur de ligne: 19px;
}
.card-value {
couleur: # 000000;
taille de la police: 1.8rem;
hauteur de ligne: 21px;
}
span text {
poids de la police: 500! important;
}
hr {
rembourrage en haut: 1.5px;
rembourrage en bas: 1px;
marge inférieure: 0;
marge supérieure: 0;
hauteur de ligne: 0.5px;
}
Écran @média uniquement et (largeur minimale: 768 pixels) {
#sidebar {
hauteur: 100vh;
}
#Info {
position: fixed;
bottom: 50px;
largeur: 100%;
padding-left: 15px;
}
.wrapper-right {
margin-top: 80px;
}
}
@media only screen and (min-width:1440px) {
#sidebar {
width: 350px;
max-width: 350px;
flex: auto;
}
#dashboard-content {
width: calc(100% — 350px);
max-width: calc(100% — 350px);
flex: auto;
}
}
In this directory, download and save the .svg
files mentioned below:
src/components/Content.vue
This is what we call a dumb component — a placeholder, that is there just to maintain the hierarchy, and essentially passes on data to its child components.
Remember that there is no technical bar for writing all our code in the App.vue
file, but we take the approach of splitting up the code by nesting the components for two reasons:
- To write clean code, which aids readability and maintainability;
- To replicate the same structure that we will see on screen, i.e., the hierarchy.
Before we nest the component defined in Content.vue
within the root component App.vue
let’s write some toy (but educational) code for Content.vue
:
This child components of Content.vue are:
- {{ child }}
In the code, carefully observe and understand the following:
- Within the
(Large preview) With the data defined and passed from the source (parent component), it is now the child’s responsibility to receive the data and render it appropriately, as explained in the next two steps.
- Receiving the data by the child
The child component, in this caseContent.vue
must receive theweather_data
object send to it by the parent componentApp.vue
. Vue.js provides a mechanism to do so — all you need is an array object calledprops
defined in the default object exported byContent.vue
. Each element of the arrayprops
is a name of the data objects it wants to receive from its parent. For now, the only data object that it is supposed to receive isweather_data
from App.vue. Thus, theprops
array looks like:
// HTML template code here
- Rendering the data in the page
Now that we have ensured receiving the data, the last task we need to complete is to render the data. For this example, we will directly dump the received data on the web page, just to illustrate the technique. However, in real applications (like the one we are about to build), data normally goes through lots of processing, and only the relevant parts of it are displayed in ways that suits the purpose. For example, in this project we will eventually get raw data from the weather API, clean and format it, feed the data to the data structures necessary for the charts, and then visualize it. Anyway, to display the raw data dump, we will just use the{{ }}
brackets that Vue understands, as shown in the snippet below:
// other template code here {{ weather_data }}It’s now time to assimilate all the bits and pieces. The code for
Content.vue
— at its current status — is given below:This child components of Content.vue are:
- {{ child }}
(Large preview) After making the changes discussed above, refresh the webpage on the browser and see how it looks. Take a moment to appreciate the complexity that Vue handles — if you modify the
weather_data
object inApp.vue
it gets silently conveyed toContent.vue
and eventually to the browser displaying the webpage! Try by changing the value for the key location.Although we have learned about props and data binding using static data, we will be using dynamic data collected using web APIs in the application, and will change the code accordingly.
Summary
Before we move on to the rest of the
.vue
files, let’s summarize what we have learnt while we wrote the code forApp.vue
andcomponents/Content.vue
:- The
App.vue
file is what we call the root component — the one that sits at the top of the component hierarchy. The rest of the.vue
files represents components that are its direct child, grandchild, and so on. - The
Content.vue
file is a dummy component — its responsibility is to pass on the data to levels below and maintain the structural hierarchy, so that our code remains consistent with the philosophy “*what we see is what we implement*”. - The parent-child relationship of component does not happen out of thin air — you must register a component (either globally or locally, depending on the intended usage of the component), and then nest it using custom HTML tags (whose spellings are the exact same as that of the names with which the components has been registered).
- Once registered and nested, data is passed on from parent to child components, and the flow is never reverse (bad things will happen if the project architecture allows backflow). The parent component is the relative source of the data, and it passes down relevant data to its children using the
v-bind
directive for the attributes of the custom HTML elements. The child receives the data intended for it using props, and then decides on its own what to do with the data.
For the rest of the components, we will not indulge in detailed explanation — we will just write the code based on the learnings from the above summary. The code will be self-evident, and if you get confused about the hierarchy, refer to the diagram below:
(Large preview) The diagram says that
TempVarChart.vue
andHighlights.vue
are the direct child ofContent.vue
. Thus, it might be a good idea to prepareContent.vue
for sending data to those components, which we do using the code below:This child components of Content.vue are:
- {{ child }}
Once you save this code, you will get errors — don’t worry, it is expected. It will be fixed once you have the rest of the component files ready. If it bothers you not to be able to see the output, comment out the lines containing the custom element tags
and
.For this section, this is the final code of
Content.vue
. For the rest of this section, we will reference to this codeand not the previous ones that we wrote for learning.src/components/TempVarChart.vue
With its parent component
Content.vue
passing on the data,TempVarChart.vue
must be set up to receive and render the data, as shown in the code below:Temperature Information:
{{ tempVar }}src/components/Highlights.vue
This component will also receive data from
App.vue
— its parent component. After that, it should be linked with its child components, and relevant data should be passed on to them.Let’s first see the code for receiving data from the parent:
Weather Highlights:
{{ highlights }}At this point, the web page looks like the image below:
(Large preview) Now we need to modify the code of
Highlights.vue
to register and nest its child components, followed by passing the data to children. The code for it is as follows:Weather Highlights:
{{ highlights }}Once you save the code and see the web page, you are expected to see errors in the Developer Console tool provided by the browser; they appear because although
Highlights.vue
is sending data, nobody is receiving them. We are yet to write the code for the children ofHighlights.vue
.Observe that we have not done much of the data processing, i.e, we have not extracted the individual factors of weather data that goes under the Highlights section of the dashboard. We could have done that in the
data()
function, but we preferred to keepHighlights.vue
a dumb component that just passes on the entire data dump it receives to each of the children, who then own their own extracts what is necessary for them. However, we encourage you to try out extracting data in theHighlights.vue
and send relevant data down to each child component — it’s a good practice exercise nonetheless!src/components/UVIndex.vue
The code for this component receives the data dump of highlights from
Highlights.vue
extracts the data for UV Index, and renders it on the page.UV Index: {{ uvindex }}
src/components/Visibility.vue
The code for this component receives the data dump of highlights from
Highlights.vue
extracts the data for Visibility, and renders it on the page.Visibility: {{ visibility }}
src/components/WindStatus.vue
The code for this component receives the data dump of highlights from
Highlights.vue
extracts the data for Wind Status (speed and direction), and renders it on the page.Wind Status:
Speed — {{ speed }}; Direction — {{ direction }}
After adding the code for all the components, take a look at the web page on the browser.
(Large preview) Not to dishearten, but all these toiling was just to link the components in hierarchy, and test out whether data flow is happening between them or not! In the next section, we will throw away most of the code we have written so farand add a lot more pertaining to the actual project. However, we will certainly retain the structure and nesting of the components; the learnings from this section will allow us to build a decent dashboard with Vue.js.
4. Data Acquisition And Processing
Remember the
weather_data
object inApp.vue
? It had some hard-coded data that we used to test whether all the components are working correctly, and also to help you learn some basic aspects of Vue application without getting bogged down in the details of real-world data. However, it’s now time that we shed our shell, and step out into the real world, where data from the API will dominate most of our code.Preparing Child Components To Receive And Process Real Data
In this section, you will get code dump for all the components except
App.vue
. The code will handle receiving real data fromApp.vue
(unlike the code we wrote in the previous section to receive and render dummy data).We strongly encourage to read the code of each component carefully, so that you form an idea of what data each of those components are expecting, and will eventually use in visualization.
Some of the code, and the overall structure, will be similar to the ones you have seen in the previous structure — so you will not face something drastically different. However, the devil is in the details! So examine the code carefully, and when you have understood them reasonably well, copy the code to the respective component files in your project.
Note: All the components in this section are in the
src/components/
directory. So each time, the path will not be mentioned — only the.vue
file name will be mentioned to identify the component.Content.vue
The following changes have been made from the previous code:
- In the
text and data within
{{ }}
has been removed, since we are now just receiving data and passing down to the children, with no rendering specific this component. - In the
export default {}
:- The
props
have been changed to match the data objects that will be send by the parent:App.vue
. The reason for changing the props is thatApp.vue
itself will display some of the data it acquires from the weather API and other online resources, based on the search query of the user, and pass on the rest of the data. In the dummy code we wrote earlier,App.vue
was passing on the entire dummy data dump, without any discrimination, and the props ofContent.vue
was set up accordingly. - The data() function now returns nothing, as we are not doing any data manipulation in this component.
- The
TempVarChart.vue
This component is supposed to receive detailed temperature projections for the rest of the current day, and eventually display them using FusionCharts. But for the time being, we will display them only as text on the webpage.
{{ tempVar.tempToday }}Highlights.vue
The changes made from the previous code are:
- In the
the text and the data within
{{ }}
has been removed, because this is a dumb component, just likeContent.vue
whose only job is to pass on the data to children while maintaining the structural hierarchy. Remember that dumb components likeHighlights.vue
andContent.vue
exists to maintain the parity between the visual structure of the dashboard, and the code we write.
UVIndex.vue
The changes made to the previous code are as follows:
- In the
and
thediv id
has been changed touvIndex
which is more readable. - In the
export default {}
thedata()
function now returns a string objectuvIndex
whose value is extracted from the highlights object received by the component usingprops
. ThisuvIndex
is now temporarily used to display the value as text within the. Later on, we will plug in this value to the data structure suitable for rendering a chart.
Visibility.vue
Visibility: {{ visibility }}
The only change made in this file (with respect to its previous code) is that the definition of the
visibility
object returned by thedata()
function now containstoString()
at its end, since the value received from the parent will be a floating point number, which needs to be converted into string.WindStatus.vue
Wind Speed — {{ windSpeed }}
Wind Direction — {{ derivedWindDirection }}, or {{ windDirection }} degree clockwise with respect to true N as 0 degree.
The changes made to the previous code are as follows:
- Throughout the file,
windstatus
has been renamed aswindStatus
to promote readability and also to be in sync with the the highlights object thatApp.vue
provides with actual data. - Similar naming changes have been made for the speed and direction — the new ones are
windSpeed
andwindDirection
. - A new object
derivedWindDirection
has come into play (also provided byApp.vue
in the highlights bundle).
For now, the received data is rendered as text; later, it will be plugged in to the data structure necessary for visualization.
Testing With Dummy Data
Resorting to dummy data repeatedly might be a bit frustrating for you, but there are some good reasons behind it:
- We have made a lot of changes to the code of each component, and it’s a good idea to test whether those changes are breaking the code. In other words, we should check that whether the data flow is intact, now that we are about to move to more complex parts of the project.
- The real data from the online weather API will need lot of massaging, and it might be overwhelming for you to juggle between the code for data acquisition and processing, and the code for smooth data flow down the components. The idea is to keep the quantum of complexity under control, so that we have a better understanding of the errors we might face.
In this section, what we do is essentially hardcode some json data in the
App.vue
which will obviously be replaced with live data in the near future. There are a lot of similarity between the dummy json structure, and the json structure we will use for the actual data. So it also provides you a rough idea of what to expect from the real data, once we encounter it.However, we admit that this is far from the ideal approach one might adopt while building such a project from scratch. In the real world, you will often start with the real data source, play around with it a bit to understand what can and should be done to tame it, and then think about the appropriate json data structure to capture the relevant information. We intentionally shielded you from all those dirty work, since it takes you farther from the objective — learning how to use Vue.js and FusionCharts to build a dashboard.
Let’s now jump into the new code for App.vue:
The changes made to the code with respect to its previous version are as follows:
- The name of the child component has been changed to dashboard-content, and accordingly the custom HTML element in the
has been revised. Note that now we have two attributes —
highlights
andtempVar
— instead of a single attribute that we used earlier with the custom element. Accordingly, the data associated with those attributes have also changed. What’s interesting here is that we can use thev-bind:
directive, or its shorthand:
(as we have done here), with multiple attributes of a custom HTML element! - The
data()
function now returns thefilename
object (that existed earlier), along with two new objects (instead of the oldweather_data
):tempVar
andhighlights
. The structure of the json is appropriate for the code we have written in the child components, so that they can extract the data pieces they need from the dumps. The structures are quite self-explanatory, and you can expect them to be quite similar when we deal with live data. However, the significant change that you will encounter is the absence of hardcoding (obvious, isn’t it) — we will leave the values blank as the default state, and write code to dynamically update them based on the values we will receive from the weather API.
You have written a lot of code in this section, without seeing the actual output. Before you proceed further, take a look at the browser (restart the server with
npm run dev
if necessary), and bask in the glory of your achievement. The web page that you should see at this point looks like the image below:
(Large preview) Code For Data Acquisition And Processing
This section is going to be the meat of the project, with all the code to be written in
App.vue
for the following:- Location input from the user — an input box and a call-to-action button is sufficient;
- Utility functions for various tasks; these functions will be called later in various parts of the component code;
- Getting detailed geolocation data from Google Maps API for JavaScript;
- Getting detailed weather data from the Dark Sky API;
- Formatting and processing the geolocation and weather data, which will be passed on to the child components.
The subsections that follows illustrates how we can implement the tasks laid out for us in the above points. With some exceptions, most of them will follow the sequence.
Input From The User
It’s quite obvious that the action starts when the user provides the name of the place for which the weather data needs to be displayed. For this to happen, we need to implement the following:
- An input box for entering the location;
- A submit button that tells our application that the user has entered the location and it’s time to do the rest. We will also implement the behavior when processing starts upon hitting Enter.
The code we show below will be restricted to the HTML template part of
App.vue
. We will just mention the name of the method associated with the click events, and define them later in the methods object of theSo far, you have encountered the names of some of the data objects, but are a lot more. Most of them are relevant for the child components, each of which handles a different aspect of the weather information dump. Given below is the entire
data()
method that we will need for this project — you will have a fair idea about what data we are expecting from the APIs, and how we are disseminating the data, based on the nomenclature of the objects.data() { return { weatherDetails: false, location: '', // raw location from input lat: '', // raw latitude from google maps api response long: '', // raw longitude from google maps api response completeWeatherApi: '', // weather api string with lat and long rawWeatherData: '', // raw response from weather api currentWeather: { full_location: '', // for full address formatted_lat: '', // for N/S formatted_long: '', // for E/W time: '', temp: '', todayHighLow: { todayTempHigh: '', todayTempHighTime: '', todayTempLow: '', todayTempLowTime: '' }, summary: '', possibility: '' }, tempVar: { tempToday: [ // gets added dynamically by this.getSetHourlyTempInfoToday() ], }, highlights: { uvIndex: '', visibility: '', windStatus: { windSpeed: '', windDirection: '', derivedWindDirection: '' }, } }; },
As you can see, in most cases the default value is empty, because that will suffice at this point. Methods will be written for manipulating the data and filling it up with appropriate values, before it is rendered or passed on to the child components.
Methods in App.vue
For
.vue
files, the methods are generally written as values of keys nested in themethods { }
object. Their primary role is to manipulate the data objects of the component. We will write the methods inApp.vue
keeping the same philosophy in mind. However, based on their purpose, we can categorize the methods ofApp.vue
into the following:- Utility methods
- Action/Event oriented methods
- Data acquisition methods
- Data processing methods
- High level glue methods
It’s important that you understand this — we are presenting the methods to you on a platter because we have already figured out how the APIs work, what data they give, and how we should use the data in our project. It’s not that we pulled the methods out of thin air, and wrote some arcane code to deal with the data. For the purpose of learning, it’s a good exercise to diligently read and understand the code for the methods and data. However, when faced with a new project that you have to build from scratch, you must do all the dirty work yourself, and that means experimenting a lot with the APIs — their programmatic access and their data structure, before glueing them seamlessly with the data structure that your project demands. You will not have any hand holding, and there will be frustrating moments, but that’s all part of maturing as a developer.
In the following subsections, we will explain each of the method types, and also show the implementation of the methods belonging to that category. The method names are quite self-explanatory about their purpose, and so is their implementation, which we believe you will find to be easy enough to follow. However, before that, recollect the general scheme of writing methods in
.vue
files:Utility Methods
The utility methods, as the name suggests, are methods written primarily for the purpose of modularizing repetitive code used for fringe tasks. They are called by other methods when necessary. Given below are the utility methods for
App.vue
:convertToTitleCase: function(str) { str = str.toLowerCase().split(' '); for (var i = 0; i
// To format the “possibility” (of weather) string obtained from the weather API formatPossibility: function(str) { str = str.toLowerCase().split('-'); for (var i = 0; i
// To convert Unix timestamps according to our convenience unixToHuman: function(timezone, timestamp) { /* READ THIS BEFORE JUDGING & DEBUGGING For any location beyond the arctic circle and the antarctic circle, the goddamn weather api does not return certain keys/values in each of this.rawWeatherData.daily.data[some_array_index]. Due to this, console throws up an error. The code is correct, the problem is with the API. May be later on I will add some padding to tackle missing values. * / var moment = require('moment-timezone'); // for handling date & time var decipher = new Date(timestamp * 1000); var human = moment(decipher) .tz(timezone) .format('llll'); var timeArray = human.split(' '); var timeNumeral = timeArray[4]; var timeSuffix = timeArray[5]; var justTime = timeNumeral + ' ' + timeSuffix; var monthDateArray = human.split(','); var monthDate = monthDateArray[1].trim(); return { fullTime: human, onlyTime: justTime, onlyMonthDate: monthDate }; },
// To convert temperature from fahrenheit to celcius fahToCel: function(tempInFahrenheit) { var tempInCelcius = Math.round((5 / 9) * (tempInFahrenheit — 32)); return tempInCelcius; },
// To convert the air pressure reading from millibar to kilopascal milibarToKiloPascal: function(pressureInMilibar) { var pressureInKPA = pressureInMilibar * 0.1; return Math.round(pressureInKPA); },
// To convert distance readings from miles to kilometers mileToKilometer: function(miles) { var kilometer = miles * 1.60934; return Math.round(kilometer); },
// To format the wind direction based on the angle deriveWindDir: function(windDir) { var wind_directions_array = [ { minVal: 0, maxVal: 30, direction: 'N' }, { minVal: 31, maxVal: 45, direction: 'NNE' }, { minVal: 46, maxVal: 75, direction: 'NE' }, { minVal: 76, maxVal: 90, direction: 'ENE' }, { minVal: 91, maxVal: 120, direction: 'E' }, { minVal: 121, maxVal: 135, direction: 'ESE' }, { minVal: 136, maxVal: 165, direction: 'SE' }, { minVal: 166, maxVal: 180, direction: 'SSE' }, { minVal: 181, maxVal: 210, direction: 'S' }, { minVal: 211, maxVal: 225, direction: 'SSW' }, { minVal: 226, maxVal: 255, direction: 'SW' }, { minVal: 256, maxVal: 270, direction: 'WSW' }, { minVal: 271, maxVal: 300, direction: 'W' }, { minVal: 301, maxVal: 315, direction: 'WNW' }, { minVal: 316, maxVal: 345, direction: 'NW' }, { minVal: 346, maxVal: 360, direction: 'NNW' } ]; var wind_direction = ''; for (var i = 0; i = wind_directions_array[i].minVal && windDir
Although we haven’t implemented it, you can take out the utility methods from the
.vue
file, and put it in a separate JavaScript file. All you need to do is import the.js
file at the start of the script part in the.vue
file, and you should be good to go. Such approach works really well and keeps the code clean, especially in big applications where you might use lots of methods that are better grouped together based on their purpose. You can apply this approach to all of the method groups listed in this article, and see the effect itself. However, we suggest you do that exercise once you have followed the course presented here, so that you have the big picture understanding of all the parts working in complete sync, and also have a working piece of software which you can refer to, once something breaks while experimenting.Action/Event Oriented Methods
These methods are generally executed when we need to take an action corresponding to an event. Depending on the case, the event might be triggered from an user interaction, or programmatically. In the
App.vue
file, these methods sit below the utility methods.makeInputEmpty: function() { this.$refs.input.value = ''; },
makeTempVarTodayEmpty: function() { this.tempVar.tempToday = []; },
detectEnterKeyPress: function() { var input = this.$refs.input; input.addEventListener('keyup', function(event) { event.preventDefault(); var enterKeyCode = 13; if (event.keyCode === enterKeyCode) { this.setHitEnterKeyTrue(); } }); },
locationEntered: function() { var input = this.$refs.input; if (input.value === '') { this.location = "New York"; } autre { this.location = this.convertToTitleCase(input.value); } this.makeInputEmpty(); this.makeTempVarTodayEmpty(); },
One interesting thing in some of the above code snippets is the use of
$ref
. In simple terms, it’s Vue’s way of associating the code statement containing it, to the HTML construct it is supposed to affect (for more information, read the official guide). For example, the methodsmakeInputEmpty()
anddetectEnterKeyPress()
affects the input box, because in the HTML of the input box we have mentioned the value of the attributeref
asinput
.Data Acquisition Methods
We are using the following two APIs in our project:
- Google Maps Geocoder API
This API is for getting the coordinates of the location that the user searches. You will need an API key for yourself, which you can get by following the documentation in the given link. For now, you can use the API key used by FusionCharts, but we request you not to abuse it and get a key of your own. We refer to the JavaScript API from the index.html of this project, and we shall use the constructors provided by it for our code in theApp.vue
file. - The Dark Sky Weather API
This API is for getting the weather data corresponding to the coordinates. However, we won’t be using it directly; we will wrap it within an URL that redirects through one of the FusionCharts’s server. The reason is that if you send a GET request to the API from an entirely client-end application such as ours, it results in the frustratingCORS
error (more information here and here).
Important Note: Since we have used Google Maps and Dark Sky APIs, Both these APIs have their own API keys which we have shared with you in this article. This will help you focus on client-side developments rather than the headache of backend implementation. However, we recommend you to create your own keysbecause our APIs keys will come with limits and if these limits exceed you won't be able to try the application by yourself.
For Google Maps, go to this article to get your API key. For Dark Sky API, visit https://darksky.net/dev to create your API key and respective endpoints.
With the context in mind, let’s see the implementation of the data acquisition methods for our project.
getCoordinates: function() { this.locationEntered(); var loc = this.location; var coords; var geocoder = new google.maps.Geocoder(); return new Promise(function(resolve, reject) { geocoder.geocode({ address: loc }, function(results, status) { if (status == google.maps.GeocoderStatus.OK) { this.lat = results[0].geometry.location.lat(); this.long = results[0].geometry.location.lng(); this.full_location = results[0].formatted_address; coords = { lat: this.lat, long: this.long, full_location: this.full_location }; resolve(coords); } autre { alert("Oops! Couldn't get data for the location"); } }); }); },
/* The coordinates that Google Maps Geocoder API returns are way too accurate for our requirements. We need to bring it into shape before passing the coordinates on to the weather API. Although this is a data processing method in its own right, we can’t help mentioning it right now, because the data acquisition method for the weather API has dependency on the output of this method. * / setFormatCoordinates: async function() { var coordinates = await this.getCoordinates(); this.lat = coordinates.lat; this.long = coordinates.long; this.currentWeather.full_location = coordinates.full_location; // Remember to beautify lat for N/S if (coordinates.lat > 0) { this.currentWeather.formatted_lat = (Math.round(coordinates.lat * 10000) / 10000).toString() + '°N'; } else if (coordinates.lat 0) { this.currentWeather.formatted_long = (Math.round(coordinates.long * 10000) / 10000).toString() + '°E'; } else if (coordinates.long
/* This method dynamically creates the the correct weather API query URL, based on the formatted latitude and longitude. The complete URL is then fed to the method querying for weather data. Notice that the base URL used in this method (without the coordinates) points towards a FusionCharts server — we must redirect our GET request to the weather API through a server to avoid the CORS error. * / fixWeatherApi: async function() { await this.setFormatCoordinates(); var weatherApi = 'https://csm.fusioncharts.com/files/assets/wb/wb-data.php?src=darksky&lat=' + this.lat + '&long=' + this.long; this.completeWeatherApi = weatherApi; },
fetchWeatherData: async function() { await this.fixWeatherApi(); var axios = require('axios'); // for handling weather api promise var weatherApiResponse = await axios.get(this.completeWeatherApi); if (weatherApiResponse.status === 200) { this.rawWeatherData = weatherApiResponse.data; } autre { alert('Hmm... Seems like our weather experts are busy!'); } },
Through these methods, we have introduced the concept of async-await in our code. If you have been a JavaScript developer for some time now, you must be familiar with the callback hellwhich is a direct consequence of the asynchronous way JavaScript is written. ES6 allows us to bypass the cumbersome nested callbacks, and our code becomes much cleaner if we write JavaScript in a synchronous way, using the async-await technique. However, there is a downside. It takes away the speed that asynchronous code gives us, especially for the portions of the code that deals with data being exchanged over the internet. Since this is not a mission-critical application with low latency requirements, and our primary aim is to learn stuff, the clean code is much more preferable over the slightly fast code.
Data Processing Methods
Now that we have the methods that will bring the data to us, we need to prepare the ground for properly receiving and processing the data. Safety nets must be cast, and there should be no spills — data is the new gold (OK, that might be an exaggeration in our context)! Enough with the fuss, let’s get to the point.
Technically, the methods we implement in this section are aimed at getting the data out of the acquisition methods and the data objects in
App.vue
and sometimes setting the data objects to certain values that suits the purpose.getTimezone: function() { return this.rawWeatherData.timezone; },
getSetCurrentTime: function() { var currentTime = this.rawWeatherData.currently.time; var timezone = this.getTimezone(); this.currentWeather.time = this.unixToHuman( timezone, currentTime ).fullTime; },
getSetSummary: function() { var currentSummary = this.convertToTitleCase( this.rawWeatherData.currently.summary ) if (currentSummary.includes(' And')) { currentSummary = currentSummary.replace(' And', ','); } this.currentWeather.summary = currentSummary; },
getSetPossibility: function() { var possible = this.formatPossibility(this.rawWeatherData.daily.icon); if (possible.includes(' And')) { possible = possible.replace(' And', ','); } this.currentWeather.possibility = possible; },
getSetCurrentTemp: function() { var currentTemp = this.rawWeatherData.currently.temperature; this.currentWeather.temp = this.fahToCel(currentTemp); },
getTodayDetails: function() { return this.rawWeatherData.daily.data[0]; },
getSetTodayTempHighLowWithTime: function() { var timezone = this.getTimezone(); var todayDetails = this.getTodayDetails(); this.currentWeather.todayHighLow.todayTempHigh = this.fahToCel( todayDetails.temperatureMax ) this.currentWeather.todayHighLow.todayTempHighTime = this.unixToHuman( timezone, todayDetails.temperatureMaxTime ).onlyTime; this.currentWeather.todayHighLow.todayTempLow = this.fahToCel( todayDetails.temperatureMin ) this.currentWeather.todayHighLow.todayTempLowTime = this.unixToHuman( timezone, todayDetails.temperatureMinTime ).onlyTime; },
getHourlyInfoToday: function() { return this.rawWeatherData.hourly.data; },
getSetHourlyTempInfoToday: function() { var unixTime = this.rawWeatherData.currently.time; var timezone = this.getTimezone(); var todayMonthDate = this.unixToHuman(timezone, unixTime).onlyMonthDate; var hourlyData = this.getHourlyInfoToday(); for (var i = 0; i
getSetUVIndex: function() { var uvIndex = this.rawWeatherData.currently.uvIndex; this.highlights.uvIndex = uvIndex; },
getSetVisibility: function() { var visibilityInMiles = this.rawWeatherData.currently.visibility; this.highlights.visibility = this.mileToKilometer(visibilityInMiles); },
getSetWindStatus: function() { var windSpeedInMiles = this.rawWeatherData.currently.windSpeed; this.highlights.windStatus.windSpeed = this.mileToKilometer( windSpeedInMiles ) var absoluteWindDir = this.rawWeatherData.currently.windBearing; this.highlights.windStatus.windDirection = absoluteWindDir; this.highlights.windStatus.derivedWindDirection = this.deriveWindDir( absoluteWindDir ) },
High Level Glue Methods
With the utility, acquisition, and processing methods out of our way, we are now left with the task of orchestrating the entire thing. We do that by creating high level glue methods, that essentially calls the methods written above in a particular sequence, so that the entire operation is executed seamlessly.
// Top level for info section // Data in this.currentWeather organizeCurrentWeatherInfo: function() { // data in this.currentWeather /* Coordinates and location is covered (get & set) in: — this.getCoordinates() — this.setFormatCoordinates() There are lots of async-await involved there. So it's better to keep them there. * / this.getSetCurrentTime(); this.getSetCurrentTemp(); this.getSetTodayTempHighLowWithTime(); this.getSetSummary(); this.getSetPossibility(); },
// Top level for highlights organizeTodayHighlights: function() { // top level for highlights this.getSetUVIndex(); this.getSetVisibility(); this.getSetWindStatus(); },
// Top level organization and rendering organizeAllDetails: async function() { // top level organization await this.fetchWeatherData(); this.organizeCurrentWeatherInfo(); this.organizeTodayHighlights(); this.getSetHourlyTempInfoToday(); },
mounted
Vue provides instance lifecycle hooks — properties that are essentially methods, and gets triggered when the instance lifecycle reaches that stage. For example, createdmountedbeforeUpdateetc., are all very useful lifecycle hooks that allows the programmer to control the instance at a much more granular level than that would have been possible otherwise.
In the code of a Vue component, these lifecycle hooks are implemented just like you would for any other
prop
. For example:Armed with this new understanding, take a look at the code below for the
mounted
prop ofApp.vue
:mounted: async function() { this.location = "New York"; await this.organizeAllDetails(); }
Complete Code For App.vue
We have covered a lot of ground in this section, and the last few sections have given you things in bits and pieces. However, it’s important that you have the complete, assembled code for
App.vue
(subject to further modifications in subsequent sections). Here it goes:And finally, after so much of patience and hard work, you can see the data flow with its raw power! Visit the application on the browser, refresh the page, search for a location in the application’s search box, and hit Enter!
(Large preview) Now that we are done with all the heavy lifting, take a break. The subsequent sections focus on using the data to create charts that are beautiful and informative, followed by giving our ugly looking application a much deserved grooming session using CSS.
5. Data Visualization With FusionCharts
Fundamental Considerations For Charts
For the end user, the essence of a dashboard is essentially this: a collection of the filtered and carefully curated information on a particular topic, conveyed through visual/graphic instruments for quick ingestion. They don’t care about the subtleties of your data pipeline engineering, or how aesthetic your code is — all they want is a high-level view in 3 seconds. Therefore, our crude application displaying text data means nothing to them, and it’s high time we implement mechanisms to wrap the data with charts.
However, before we dive deep into the implementation of charts, let’s consider some pertinent questions and the possible answers from our perspective:
- What type of charts are appropriate for the type of data we are dealing with?
Well, the answer has two aspects — the context, and the purpose. By context, we mean the type of data, and it’s overall fit in the scheme of bigger things, bounded by the scope and audience of the project. And by purpose, we essentially mean “what we want to emphasize on?”. For example, we can represent today’s temperature at different times of the day by using a Column chart (vertical columns of equal width, with height proportional to the value the column represents). However, we are rarely interested in the individual values, but rather the overall variation and trend throughout the data. To suit the purpose, it is in our best interest to use a Line chartand we will do that shortly. - What should be kept in mind before selecting a charting library?
Since we are doing a project predominantly using JavaScript based technologies, it’s a no-brainer that any charting library that we choose for our project should be a native of the JavaScript world. With that basic premise in mind, we should consider the following before zeroing down on any particular library:- Support for the frameworks of our choicewhich in this case, is Vue.js. A project can be developed in other popular JavaScript frameworks like React, or Angular — check the support of the charting library for your favorite framework. Also, support for other popular programming languages like Python, Java, C++, .Net (AS and VB), especially when the project involves some serious backend stuff, must be considered.
- Availability of charts types and featuressince it is almost impossible to know beforehand what will be final shape and purpose of the data in the project (especially if the requirements are regulated by your clients in a professional setting). In this case, you should cast your net wide, and choose a charting library that has the widest collection of charts. More importantly, to differentiate your project from others, the library should have have enough features in the form of configurable chart attributes, so that you can fine-tune and customize most aspects of the charts and the right level of granularity. Also, the default chart configurations should be sensible, and the library documentation has to be top notch, for reasons that’s obvious to professional developers.
- Learning curve, support community, and balance must also be taken into consideration, especially when you are new to data visualization. On one end of the spectrum, you have proprietary tools like Tableau and Qlickview that costs a bomb, has smooth learning curve, but also comes with so many limitations in terms of customizability, integration, and deployment. On the other end there is d3.js — vast, free (open source), and customizable to its core, but you have to pay the price of a very steep learning curve to be able to do anything productive with the library.
What you need is the sweet spot — the right balance between productivity, coverage, customizability, learning curve, and off course, cost. We nudge you to take a look at FusionCharts — the world’s most comprehensive and enterprise-ready JavaScript charting library for the web and mobile, that we will be using in this project for creating charts.
Introduction To FusionCharts
FusionCharts is used worldwide as the go-to JavaScript charting library by millions of developers spread across hundreds of countries around the globe. Technically, it’s as loaded and configurable as it can be, with support for integrating it with almost any popular tech stack used for web based projects. Using FusionCharts commercially requires a license, and you have to pay for the license depending on your use case (please contact sales if you are curious). However, we are using FusionCharts in this projects just to try out a few things, and therefore the non-licensed version (comes with a small watermark in your charts, and a few other restrictions). Using the non-licensed version is perfectly fine when you are trying out the charts and using it in your non-commercial or personal projects. If you have plans to deploy the application commercially, please ensure that you have a license from FusionCharts.
Since this is a project involving Vue.js, we will need two modules that needs to be installed, if not done earlier:
- The
fusioncharts
module, because it contains everything you will need for creating the charts - The
vue-fusioncharts
module, which is essentially a wrapper for fusioncharts, so that it can be used in a Vue.js project
If you have not installed them earlier (as instructed in the third section), install them by executing the following command from the project’s root directory:
npm install fusioncharts vue-fusioncharts --save
Next, ensure that the
src/main.js
file of the project has the following code (also mentioned in section 3):import Vue from 'vue'; import App from './App.vue'; import FusionCharts from 'fusioncharts'; import Charts from 'fusioncharts/fusioncharts.charts'; import Widgets from 'fusioncharts/fusioncharts.widgets'; import PowerCharts from 'fusioncharts/fusioncharts.powercharts'; import FusionTheme from 'fusioncharts/themes/fusioncharts.theme.fusion'; import VueFusionCharts from 'vue-fusioncharts'; Charts(FusionCharts); PowerCharts(FusionCharts); Widgets(FusionCharts); FusionTheme(FusionCharts); Vue.use(VueFusionCharts, FusionCharts); new Vue({ el: '#app', render: h => h(App) })
Perhaps the most critical line in the above snippet is the following:
Vue.use(VueFusionCharts, FusionCharts)
It instructs Vue to use the vue-fusioncharts module for making sense of many things in the project that are apparently not explicitly defined by us, but is defined in the module itself. Also, this type of statement implies global declaration, by which we mean that anywhere Vue encounters anything strange in the code of our project (things that we have not explicitly defined about using FusionCharts), it will at least look once in the vue-fusioncharts and fusioncharts node modules for their definitions, before throwing up errors. If we would have used FusionCharts in an isolated part of our project (not using it in almost all of the component files), then perhaps local declaration would have made more sense.
With that, you are all set to use FusionCharts in the project. We will be using quite a few variety of charts, the choice being dependent on the aspect of the weather data that we want to visualize. Also, we will get to see the interplay of data binding, custom components, and watchers in action.
General Scheme For Using Fusioncharts In
.vue
FilesIn this section, we will explain the general idea of using FusionCharts for creating various charts in the
.vue
files. But first, let’s see the pseudocode that schematically illustrates the core idea.Let’s understand different parts of the above pseudocode:
- In the
within the top level
(that’s pretty much mandatory for the template HTML code of every component), we have the custom component
. We have the definition of the component contained in thevue-fusioncharts
Node module that we have installed for this project. Internally,vue-fusioncharts
relies on thefusioncharts
module, which have also been installed. We imported the necessary modules and resolved their dependencies, instructed Vue to use the wrapper globally (throughout the project) in thesrc/main.js
file, and therefore there is no lack of definition for the custom
component that we have used here. Also, the custom component has custom attributes, and each of the custom attribute is bound to a data object (and in turn, their values), by thev-bind
directive, for which the shorthand is the colon (:
) symbol. We will learn about the attributes and their associated data objects in a greater detail, when we discuss some of the specific charts used in this project.- In the
src/components/UVIndex.vue
This component contains an extremely useful chart — the Angular Gauge.
(Large preview) The code for the component is given below. For detailed information on the chart attributes of Angular Gauge, refer to FusionCharts Dev Center page for Angular Gauge.
src/components/Visibility.vue
In this component, we use a Horizontal Linear Gauge to represent the visibility, as shown in the image below:
(Large preview) The code for the component is given below. For an in depth understanding of the different attributes of this chart type, please refer to FusionCharts Dev Center page for Horizontal Linear Gauge.
src/components/WindStatus.vue
This component displays the wind speed and direction (wind velocity, if you are physics savvy), and it is very difficult to represent a vector using a chart. For such cases, we suggest representing them with the aid of some nice images and text values. Since the representation we have thought about is entirely dependent on CSS, we will implement it in the next section that deals with the CSS. However, take a look at what we are aiming to create:
(Large preview) Wind StatusWind Direction
{{ highlights.windStatus.derivedWindDirection }}
Wind Speed
{{ highlights.windStatus.windSpeed }} km/h
Wrapping Up With Highlights.vue
Recall that we have already implemented code with CSS for all the components — except
Content.vue
andHighlights.vue
. SinceContent.vue
is a dumb component that just relays data, the minimal styling it needs has already been covered. Also, we have already written appropriate code for styling the sidebar and the cards containing the charts. Therefore, all we are left to do is add some stylistic bits toHighlights.vue
which primarily involves using the CSS classes:HighlightsDeployment And Source Code
With the charts and style in order, we are done! Take a moment to appreciate the beauty of your creation.
(Large preview) It’s now time for you to deploy your application, and share it with your peers. If you don’t have much idea about deployment and expect us to help you, look here about our take on deployment ideas. The linked article also contains suggestions on how to remove the FusionCharts watermark at the left bottom of every chart.
If you mess up somewhere and want a reference point, the source code is available on Github.
(ms, ra, il)
Source link - In the
- Receiving the data by the child